Rooftop Solar by California City
May 2019 • EBCE
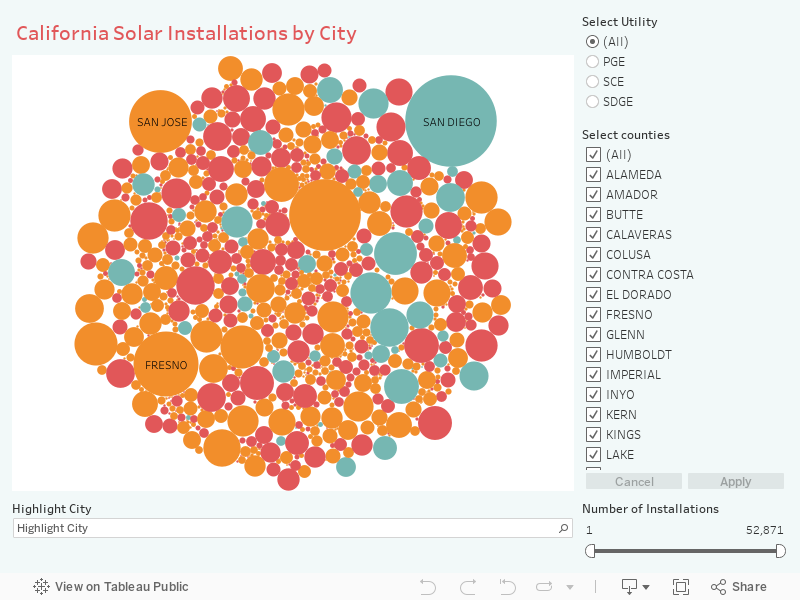
Data from January 2020 on distributed solar in the service territories of investor-owned utilities only. Filter for counties and cities. CPUC data.
Baywheels Bike Usage
June 2021 • Berkeley Energy Commission
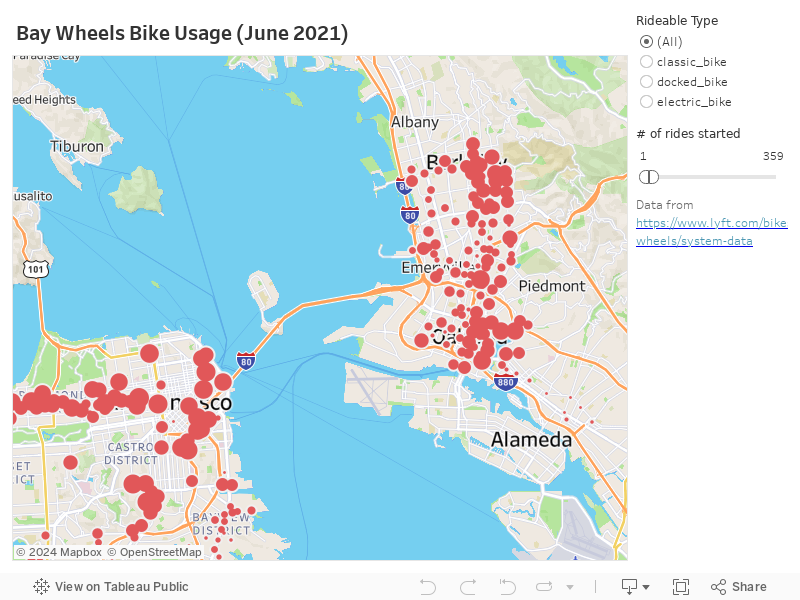
Usage of the BayWheels bike share program, June 2021.
CAISO generation on one day
March 2017 • Greentech Media
This figure shows the impact of solar on dispatch decisions in California. It was made using Infogram to accompany an article for Greentech Media, “Too Much of a Good Thing? An Illustrated Guide to Solar Curtailment on California’s Grid.” Click on the legend dots to toggle the data sets on and off.
DOE Forecasts of US Biopower Growth
2017 • Energy Transition
This chart, made with Datawrapper, shows how Energy Information Administration has changed their annual forecasts for the growth of biopower — always down. It was made for an article on Energy Transition, “Dispelling Myths About Biopower.”